What are you looking for?
How to Pay for College Booklet
The "How to Pay for College: A Guide for Arkansas Students" booklet is now available! This booklet is published yearly by the Arkansas Student Loan Authority and details the financial aid process and available programs to help your student find aid.
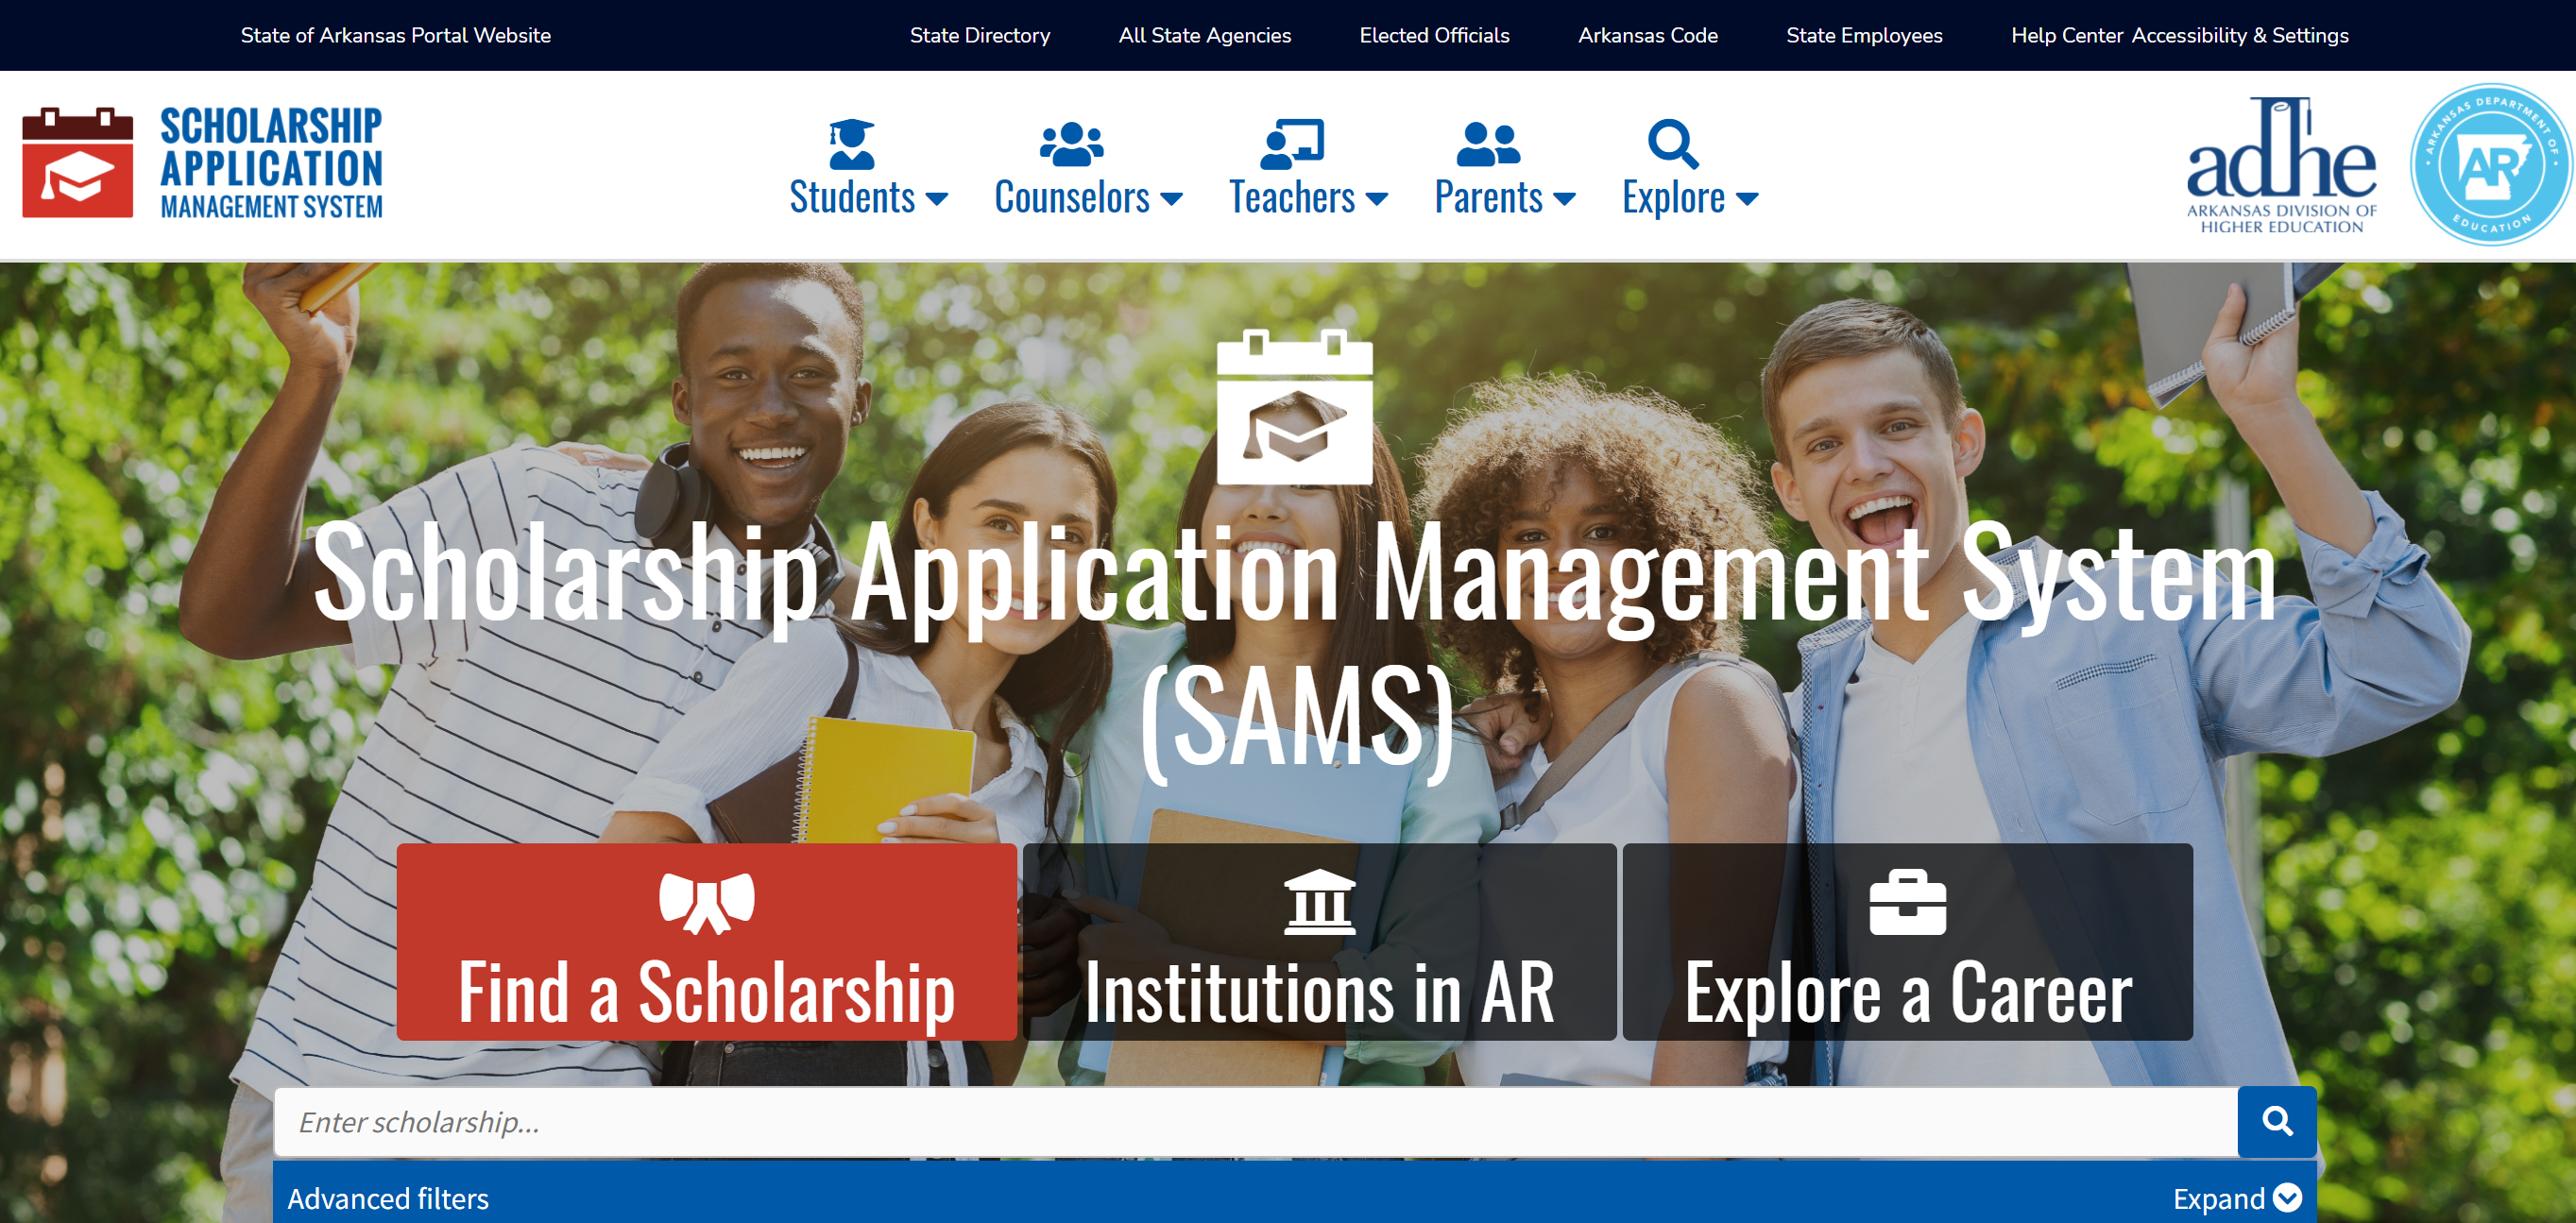
Scholarship Application Management System
Visit Scholarship Application Management System Portal! This site includes information on scholarships, colleges, and exploring AR careers.

Explore Arkansas Careers
Looking for programs that qualify for the Arkansas Future (ArFuture) Grant or Arkansas Workforce Challenge? Explore Arkansas Careers can help you find eligible programs and search for training for your dream job!

Colleges and Universities
Arkansas is home to over 40 institutions of higher education. Learn more about all the great colleges and universities around the state!
Welcome!
The Arkansas Division of Higher Education manages the state’s scholarship and financial aid programs; recommends higher education and institutional budgets to the legislature; assures academic program quality and viability; provides professional development for faculty and staff; provides educational support to business and industry; provides institutional accountability; and promotes the importance of postsecondary education in enhancing both personal and community quality of life. Our primary goal is to support the improvement of educational attainment in the state of Arkansas in an efficient and effective way.
Our Mission and Strategic Goals
The mission of the Arkansas Division of Higher Education is to advocate for higher education; to promote a coordinated system of higher education in the state; and to assist each of the publicly and locally supported institutions of higher education in the state in improving the delivery of higher education services to the citizens of Arkansas.
GOAL #1 Credentials
Increase the total number of individuals with targeted credentials by 81,360 by 2026
GOAL #2 Affordability
Improve the affordability of higher education for Arkansans
GOAL #3 Equity
Increase participation and attainment by underserved student groups by 5% annually
GOAL #4 Workforce Development
Increase regional credentials to match targeted workforce demand

Events & Deadlines
Check out upcoming ADHE events and important dates
-
Apr 26 2024
-
Apr 26 2024
-
May 1 2024Out-of-State Institutions - New Program Proposals Due - July AHECB Meeting Academic Affairs 12:00 PM

Press Releases
Check out important announcements released
Locate Colleges & Universities in Arkansas
Check the list of colleges that participate in Arkansas.

Connect with Us
Follow us on our social networks to stay on top of the trending topics, and news directly to your feed!
